
Running code
Znote turns your markdown notes into runnable notebooks: any fenced code block can be executed in place, and its result is displayed — and saved — right below the block.
The basics
- Enable Allow to Run code on the note (code icon in the action bar).
- Press Cmd+Enter (or Ctrl+Enter on Windows/Linux) to run the current block, or click ▶.
- Ctrl+Space opens code completion with ready-to-use snippets for everything on this page.
Three kinds of blocks run out of the box:
| Block | Runs as |
|---|---|
```js | Browser JavaScript (DOM, charts, React…) |
```js + //exec: node | A Node.js child process (filesystem, require, npm packages) |
```bash (or powershell, batch) | A shell script |
Print results
console.log("Hello World! 👋");
print("Same thing");
printInline("no line break");
printJSON({ name: "Znote", version: "4.4" });   // pretty-printed JSON
Tabular data looks better in an interactive datagrid (sortable, paginated):
const r = await fetch("https://jsonplaceholder.typicode.com/users");
showDatagrid({ data: await r.json(), pagination: true });
Read & write files
Use the built-in _fs (Node's fs) and __dirname (the note's working folder):
// Read a local file
const csv = _fs.readFileSync("/Users/me/Documents/expenses.csv", "utf8");
print(csv);

// Write next to your notes
_fs.writeFileSync(__dirname + "/dataset.json", JSON.stringify(data));
Convert a CSV to objects with the built-in csvJSON:
const records = csvJSON(csv, ";");   // delimiter: "," ";" or "\t"
showDatagrid({ data: records, pagination: true });
And run any shell command with exec:
const { stdout } = await exec("git -C ~/my-project log --oneline -10");
print(stdout);
Call an API
Put shared config in a global block, then keep one block per request — your note becomes a living API playground:
```js global;
const baseURL = "https://jsonplaceholder.typicode.com";
const headers = { "Content-Type": "application/json" };
```

```js
const res = await fetch(`${baseURL}/users`, { headers });
showDatagrid({ data: await res.json(), pagination: true });
```

```js
const res = await fetch(`${baseURL}/users`, {
  method: "POST",
  headers,
  body: JSON.stringify({ name: "John Doe", email: "john@example.com" })
});
printJSON(await res.json());
```
Make charts
Znote ships chart helpers (powered by ApexCharts) that take simple series data — no library setup:
barChart({
  series: [
    { name: "PRODUCT A", data: [14, 25, 21, 17] },
    { name: "PRODUCT B", data: [13, 23, 20, 8] }
  ],
  categories: ["Q1", "Q2", "Q3", "Q4"]
});
Available: barChart, lineChart, areaChart, bubbleChart, radialChart.
From raw data: toSeries
Real data is usually a flat array of objects. toSeries pivots it into chart series (toTimeSeries and toBubbleSeries exist too):
const json = [
  { channel: "Facebook", month: "2023-01", total_sales: 150 },
  { channel: "Facebook", month: "2023-02", total_sales: 113 },
  { channel: "Google",   month: "2023-01", total_sales: 235 },
  { channel: "Google",   month: "2023-02", total_sales: 195 }
];

barChart({
  series: toSeries({ data: json, x: "month", y: "total_sales", category: "channel" }),
  categories: [...new Set(json.map(e => e.month))]
});
A complete example: chart a CSV
const url = "https://raw.githubusercontent.com/plotly/datasets/master/2014_world_gdp_with_codes.csv";
const json = csvJSON(await fetch(url).then(r => r.text()), ",");

const top10 = json
  .sort((a, b) => parseFloat(b["GDP (BILLIONS)"]) - parseFloat(a["GDP (BILLIONS)"]))
  .slice(0, 10);

barChart({
  title: "Top 10 countries by GDP (2014)",
  series: toSeries({ data: top10, x: "COUNTRY", y: "GDP (BILLIONS)" }),
  categories: top10.map(e => e.COUNTRY)
});
Keep the chart in the note
Click the camera button on the runner to save the rendered chart into the note as an image — see Persisted results.
For full control, Plotly.js and Danfo.js are pre-installed — render into the block's el container:
Plotly.newPlot(el, [{ values: [19, 26, 55], labels: ["A", "B", "C"], type: "pie" }], { height: 400 });Shape your data
Built-in helpers for the usual JSON wrangling:
const senators = (await (await fetch("https://www.govtrack.us/api/v2/role?current=true&role_type=senator")).json())
  .objects.map(s => flatten(s));          // flatten nested objects → "person.firstname"

showDatagrid({
  data: filter(senators, ["party", "person.firstname", "person.lastname"]),  // keep keys
  pagination: true
});

// exclude(json, ["id", "internal_field"])  → the opposite of filter
Pass data between blocks with blockName + loadBlock — for example a json or csv block holding your data, loaded from a js block.
Query data with SQL
Run SQL over any JSON/CSV in memory with AlaSQL (npm install --save alasql in a bash block — see NPM packages):
const alasql = require("alasql");
const tsv = await fetch("https://cdn.jsdelivr.net/npm/world-atlas@1/world/110m.tsv").then(r => r.text());
const json = csvJSON(tsv, "\t");

const data = alasql(`
  SELECT continent, SUM(CAST(pop_est AS NUMBER)) AS total_pop
  FROM ? GROUP BY continent ORDER BY total_pop DESC
`, [json]);

showDatagrid({ data });
Real databases (MySQL/MariaDB, PostgreSQL, SQL Server, SQLite) are covered by the Local SQL plugin — see the Query a Local DB recipe.
Render HTML & React
Every block gets an htmlEl container you can render into:
import React from 'react';
import ReactDOM from 'react-dom';

const Title = (props) => <h1>{props.text}</h1>;
ReactDOM.render(<Title text="Hello from React!" />, htmlEl);
el is the same container's id — handy for libraries that take an element id.
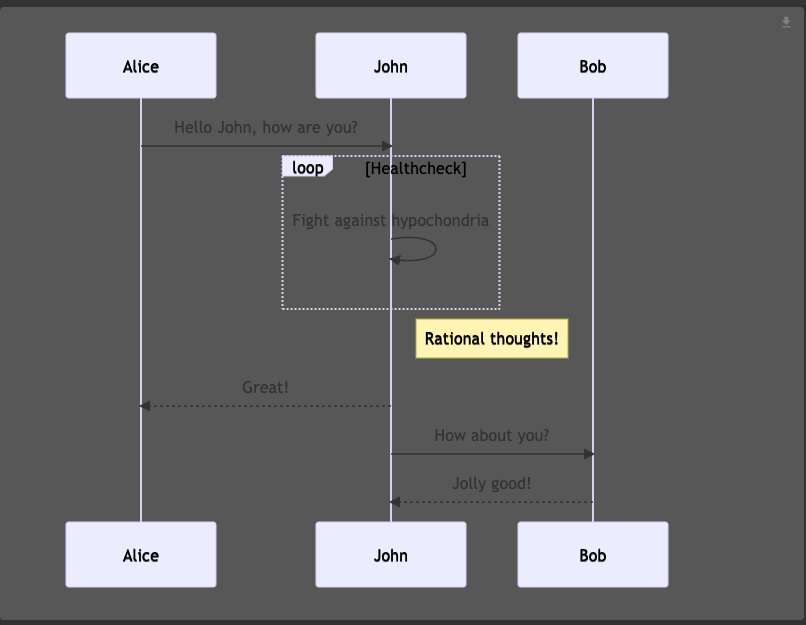
Diagrams with Mermaid
```mermaid
sequenceDiagram
Alice->>John: Hello John, how are you?
John-->>Alice: Great!
```
Go further
- Code block parameters —
global,preload,hide,save/noSave,//exec: node… - Persisted results — how results are saved into the markdown
- NPM packages — install anything from npm
- Recipes — ready-to-run templates: API playground, SQL on CSV, expense tracker, changelog generator, LLM calls…